Engineered for 24/7 network operations centers. Color-coded wallboard health tiles, multi-vendor fleet inventory, hardware telemetry dials, automated Layer-2 neighbor discovery (LLDP/MNDP/CDP), a Network Map with root cause analysis, and live DHCP lease tracking.
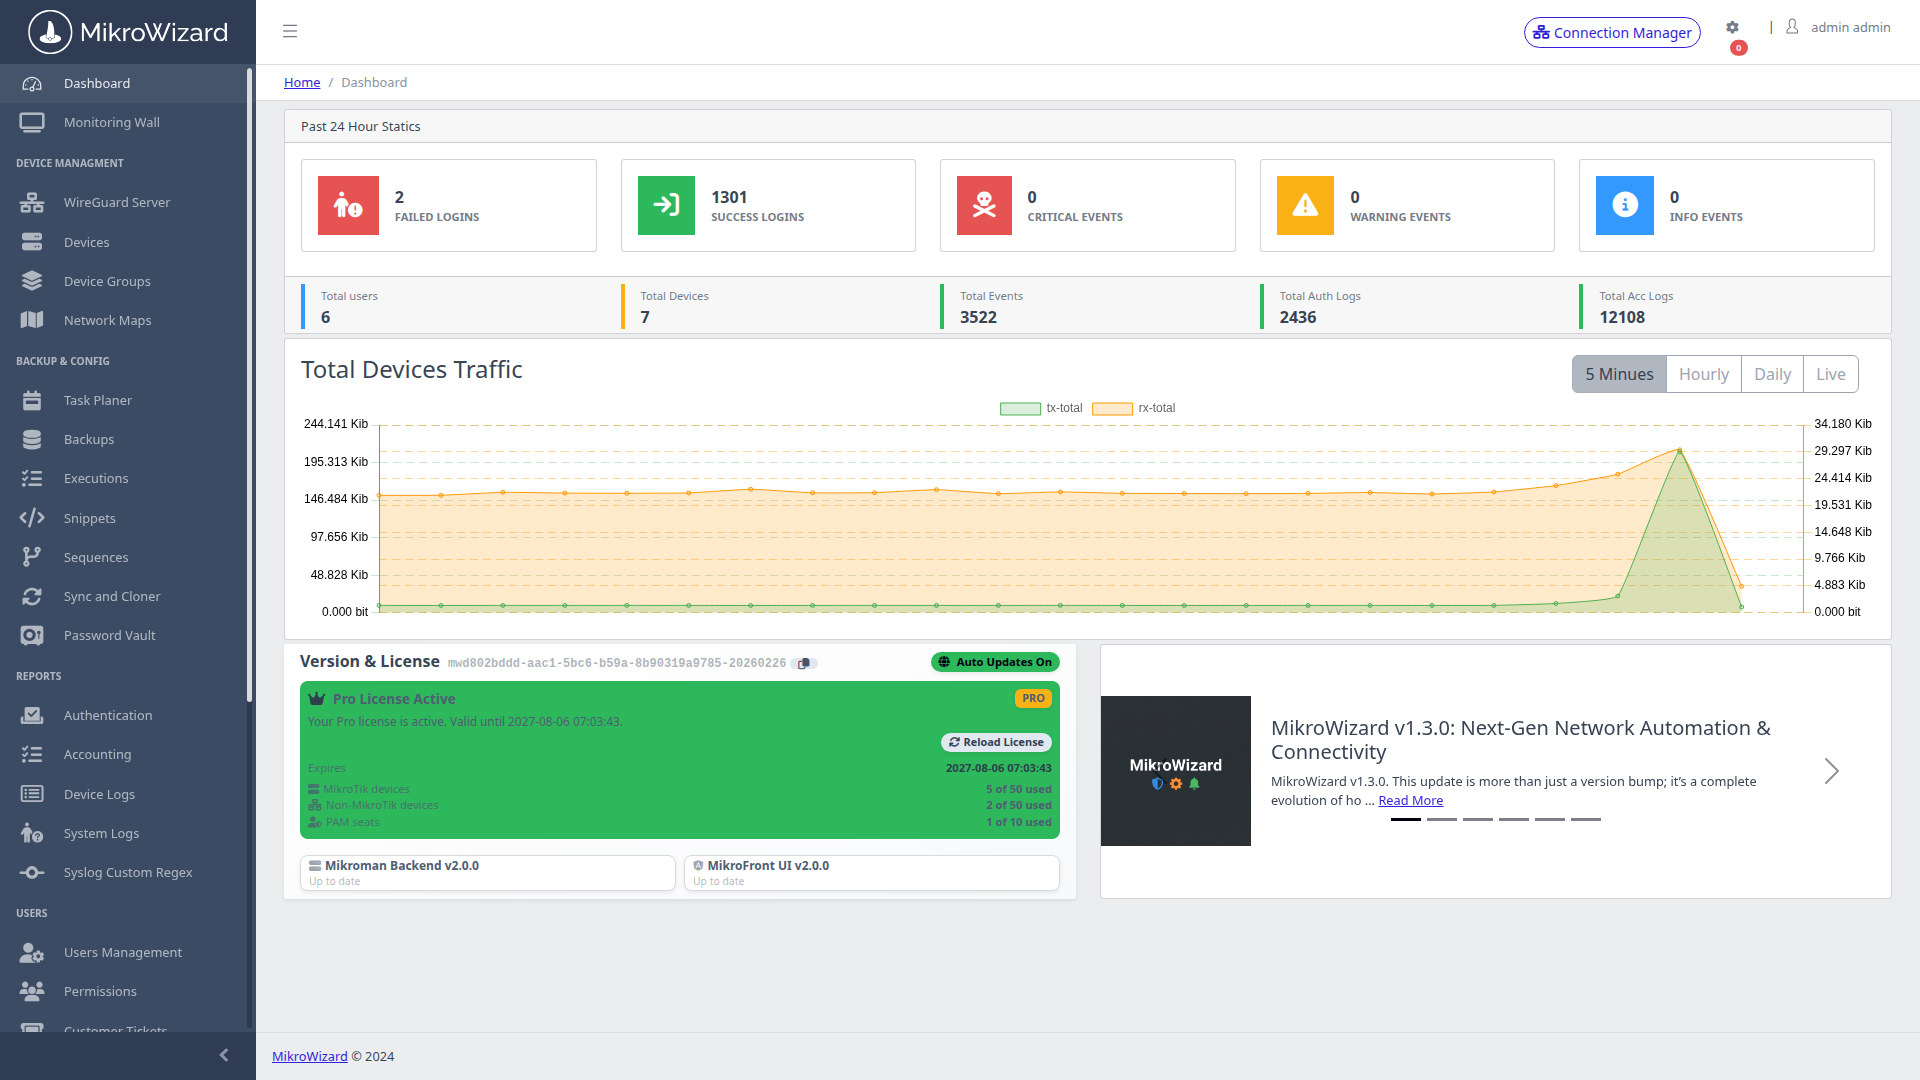
Get an instantaneous executive view of your entire infrastructure. Aggregates fleet-wide online/offline health ratios, RouterOS v6 vs v7 software version distribution, active alerts, and top bandwidth consumers.
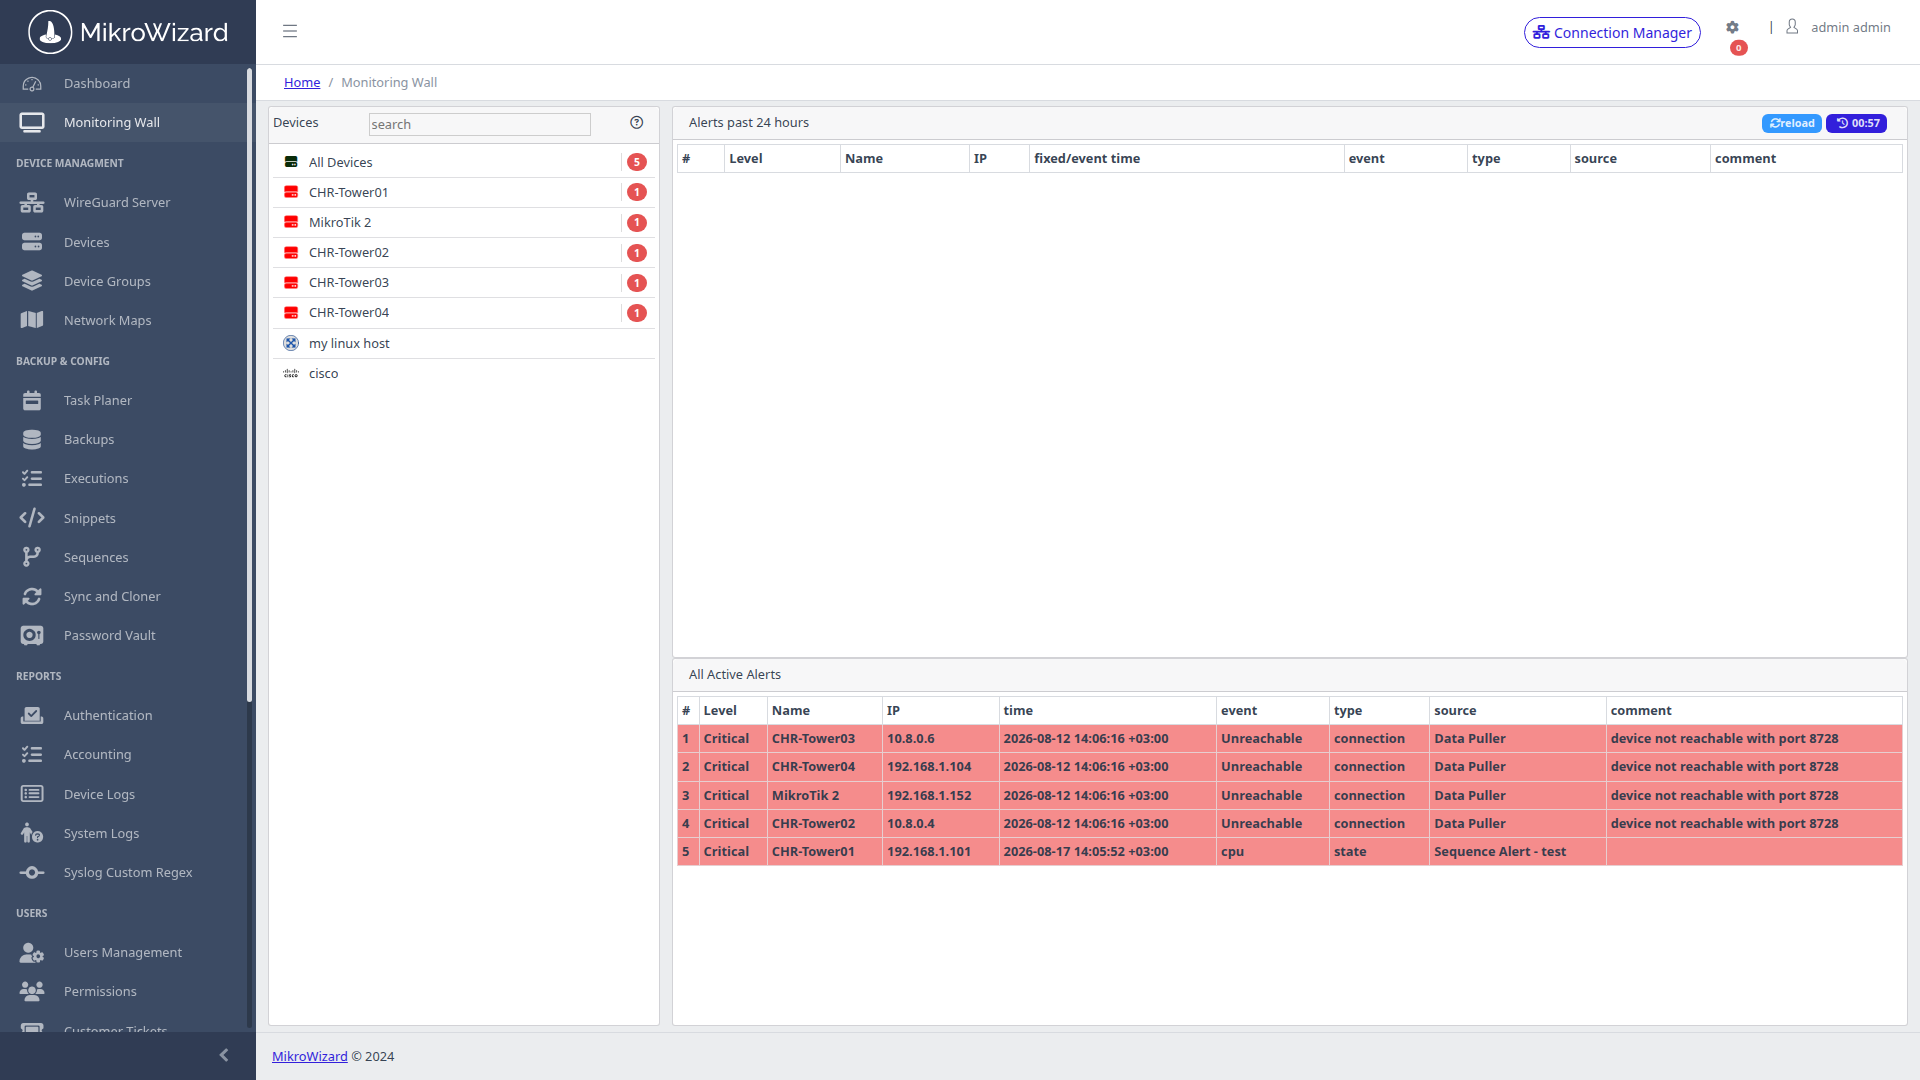
Optimized for large NOC wall displays and 24/7 incident triage. Renders dense, color-coded health tiles (Green = Healthy, Yellow = Degraded, Red = Unreachable) across thousands of nodes.
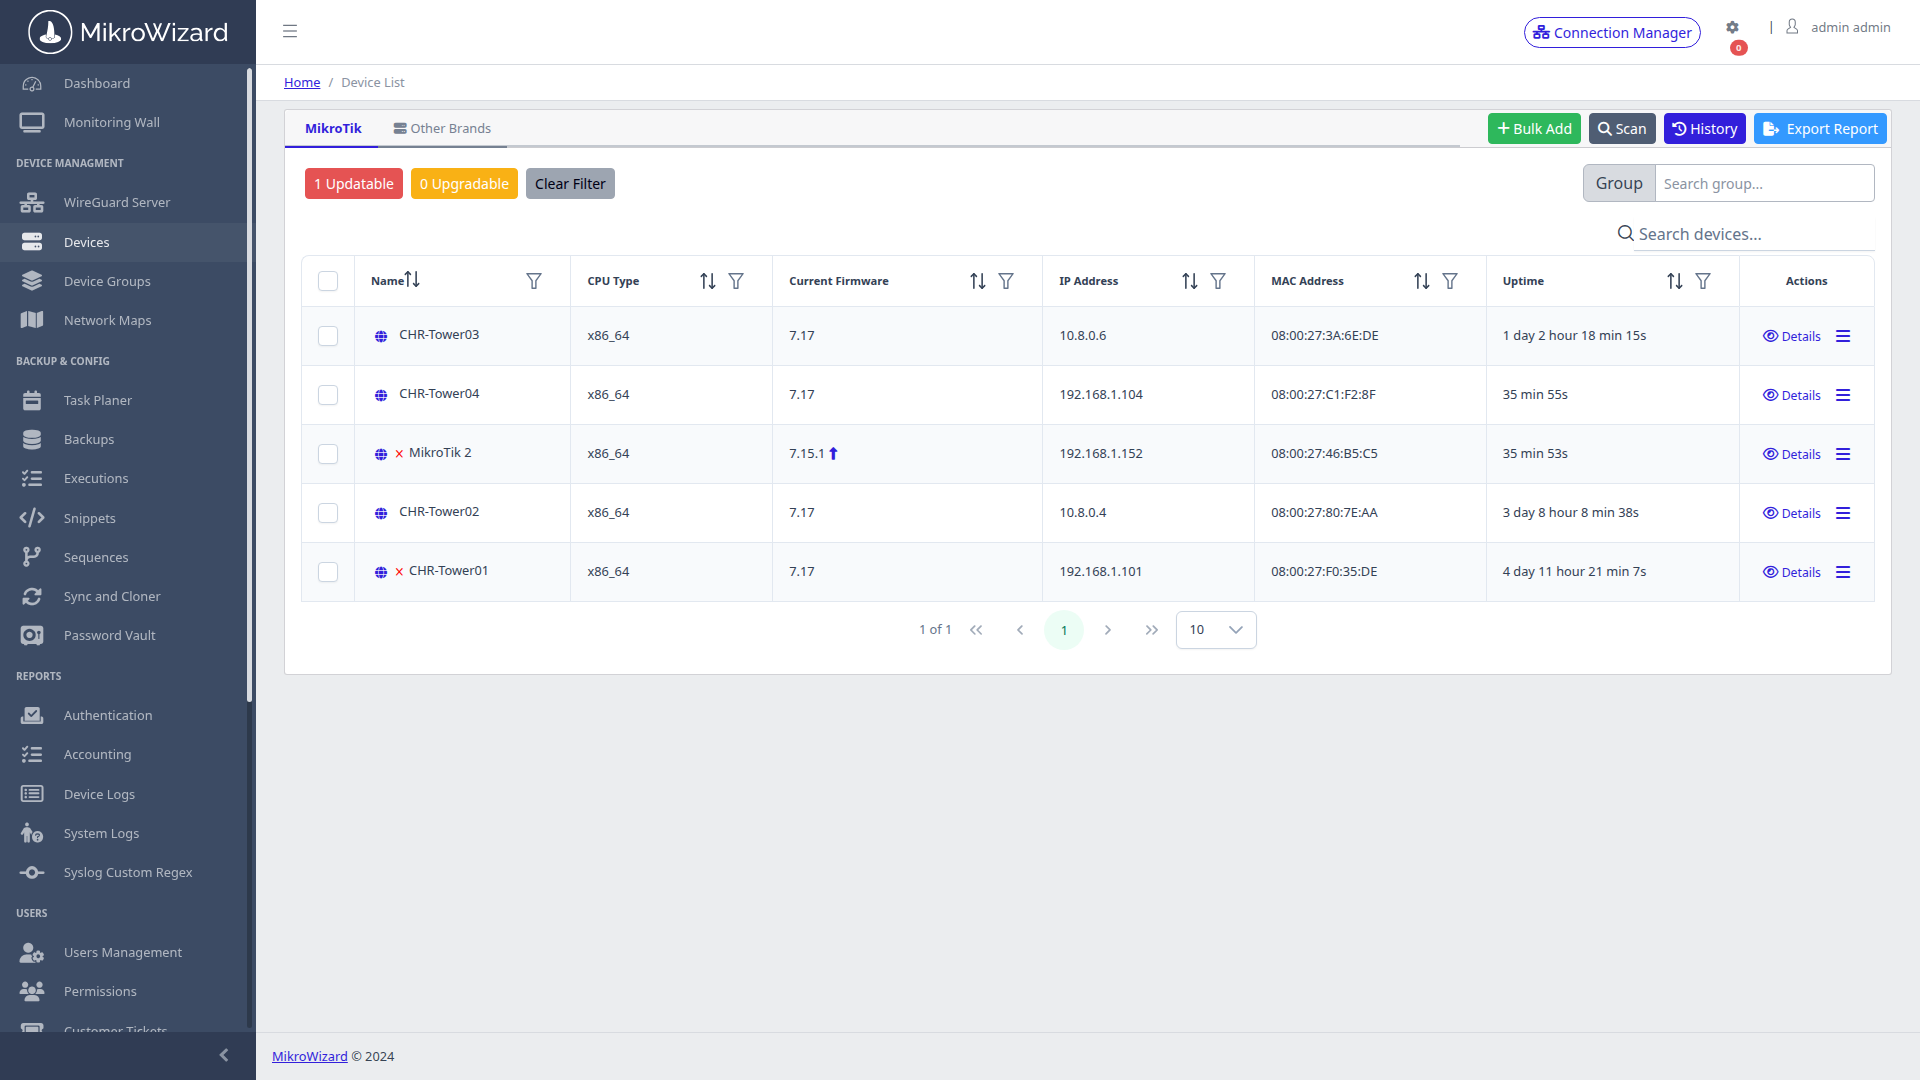
Comprehensive multi-vendor inventory database. Onboard hundreds of routers in minutes via bulk CSV import or run the built-in IP Subnet Scanner Wizard.
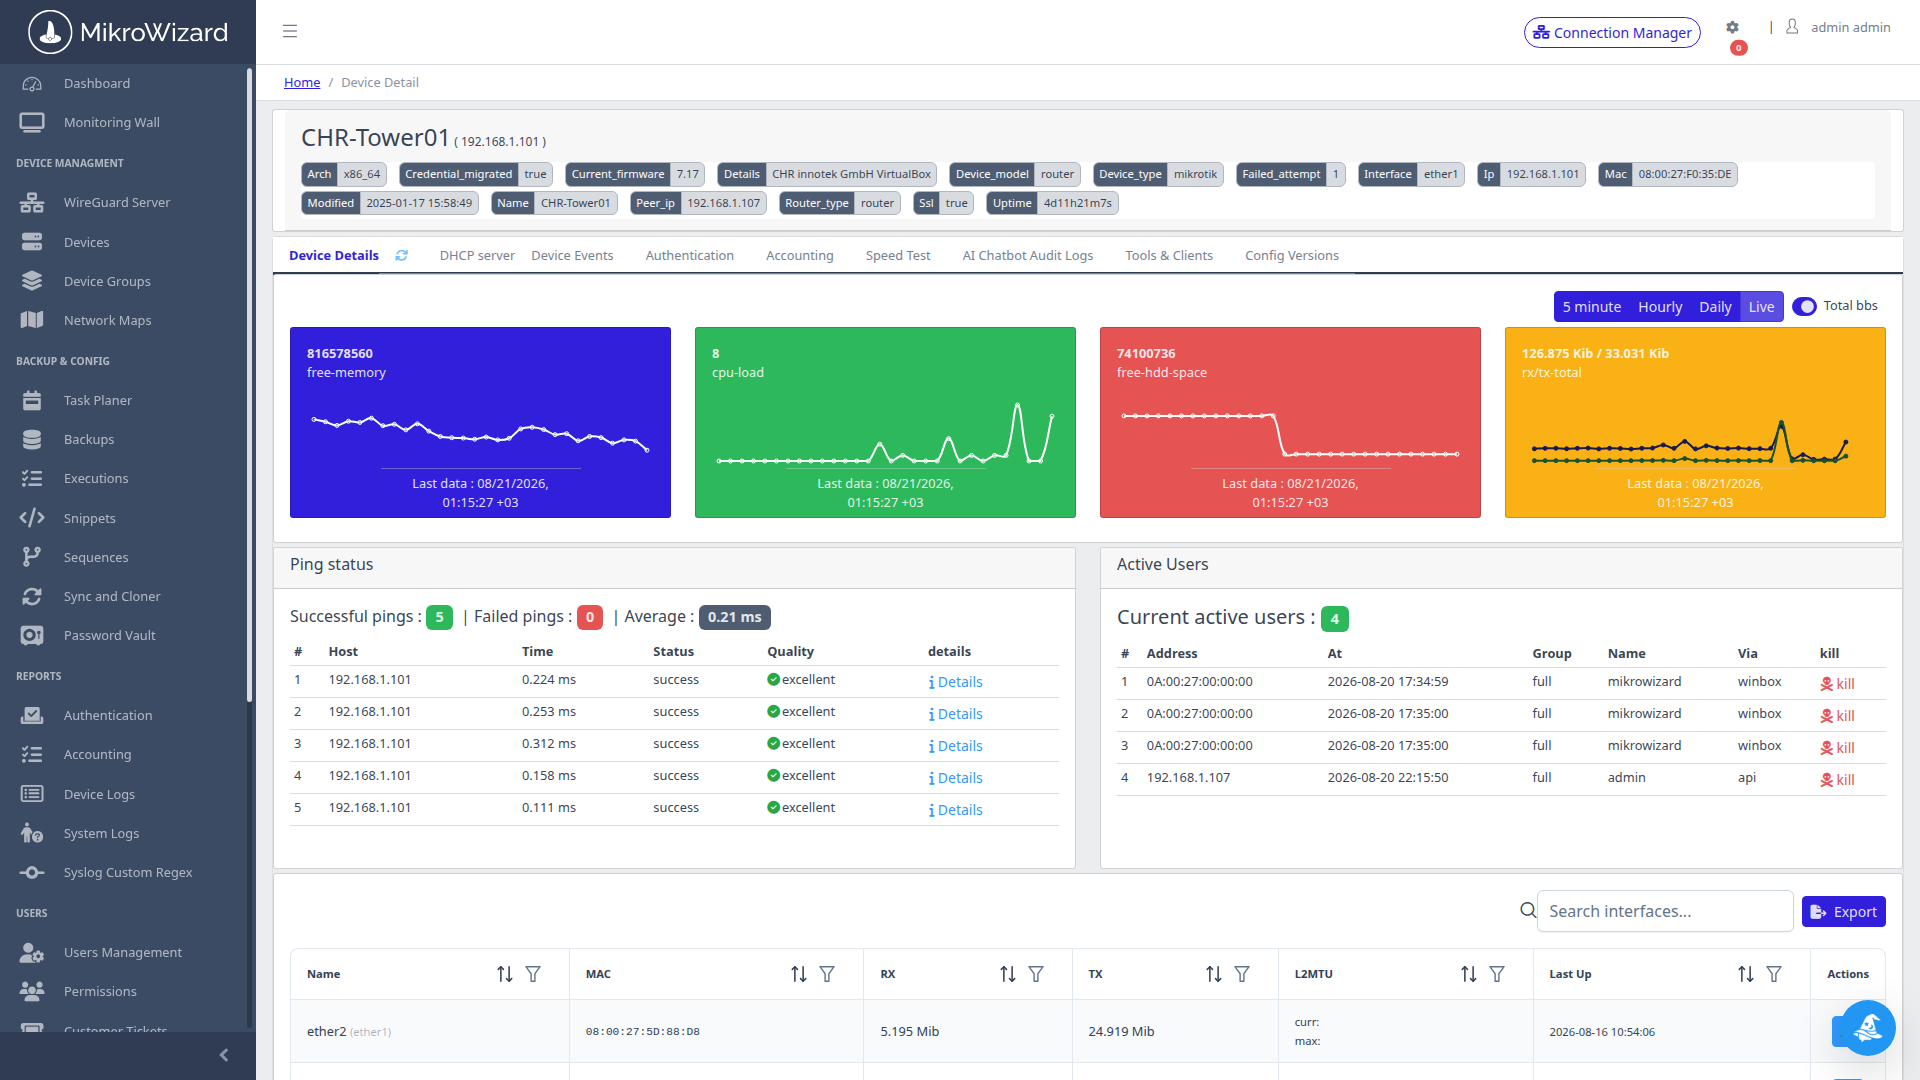
Drill into individual router performance without overloading CPU with resource-intensive Winbox GUI pollers.
Structure complex networks into logical, hierarchical tree groups (e.g. Region / Datacenter / Core / Edge or Client / Branch).
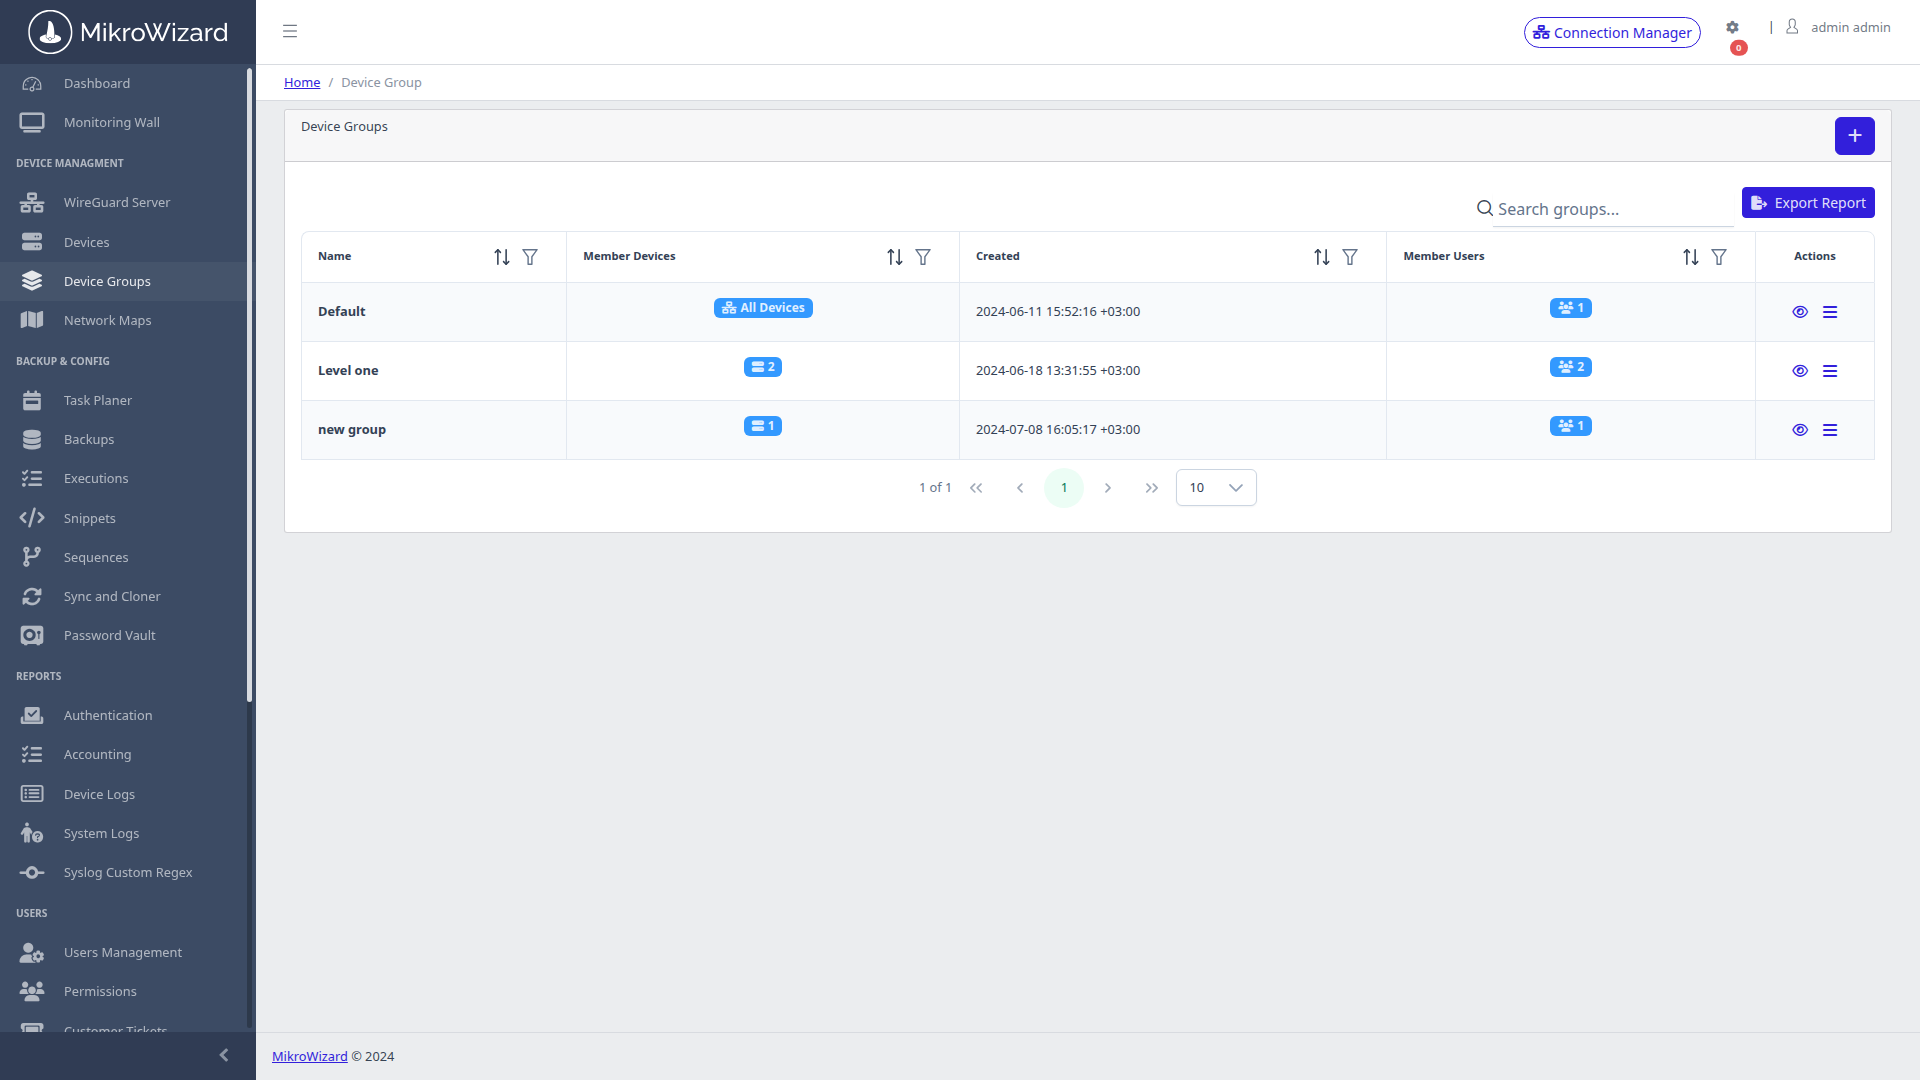
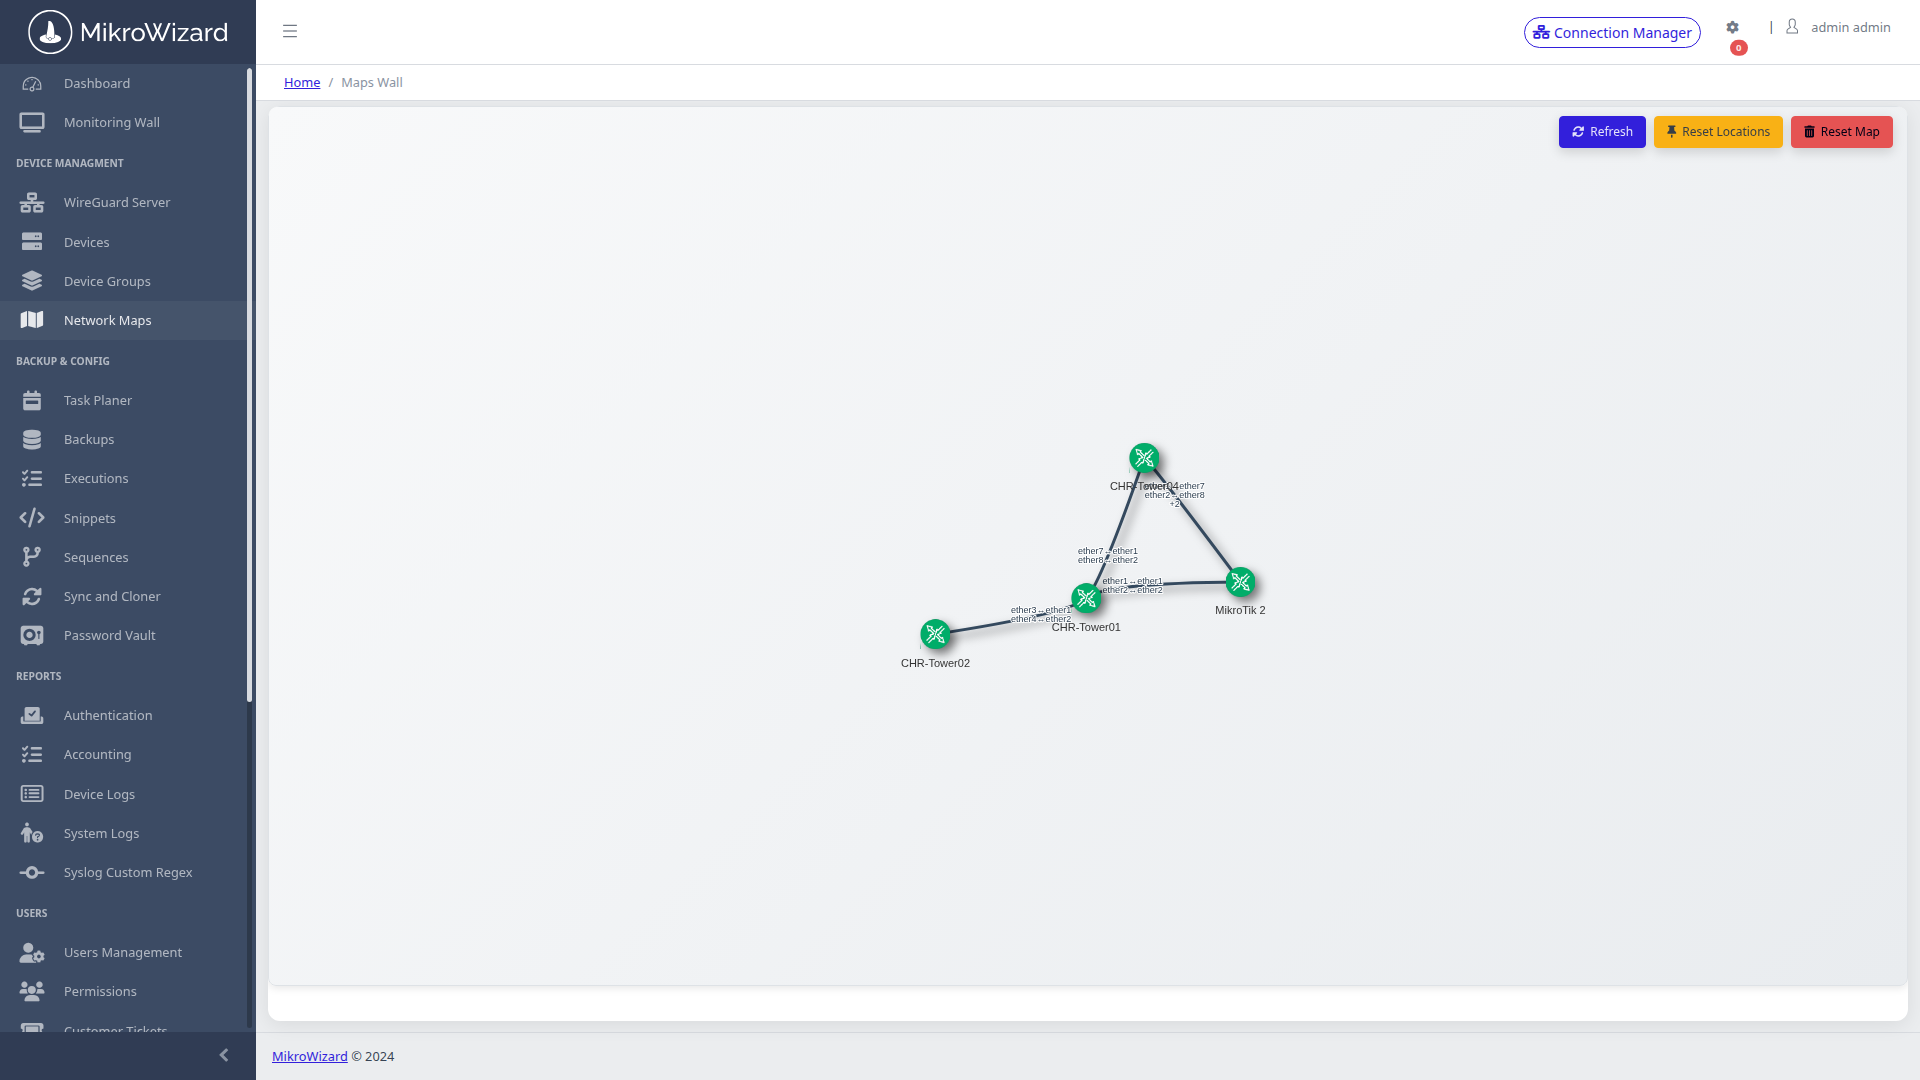
Stop maintaining static PDF network diagrams. MikroWizard continuously queries neighbor discovery tables (LLDP, MikroTik MNDP, and Cisco CDP) to render living, physics-based network topology graphs.
The Network Map was rebuilt in MikroWizard 2.1.0. It is drawn from MikroTik neighbour discovery (MNDP, LLDP and CDP), and its Problems drawer separates the device that actually failed from the devices that are only unreachable because of it. You fix the cause instead of chasing a list of red nodes.
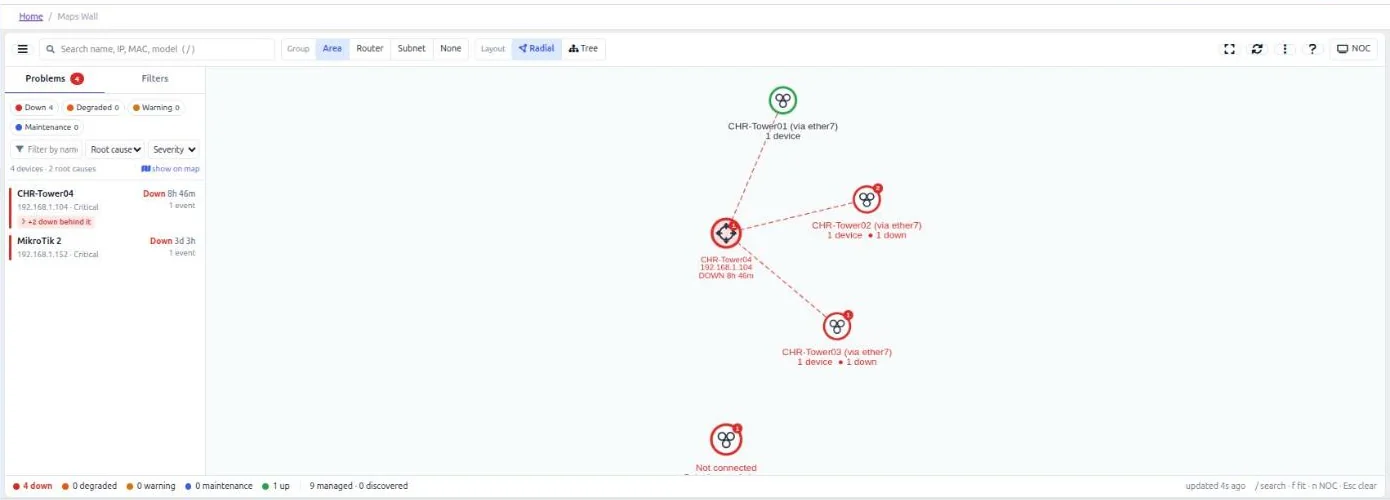
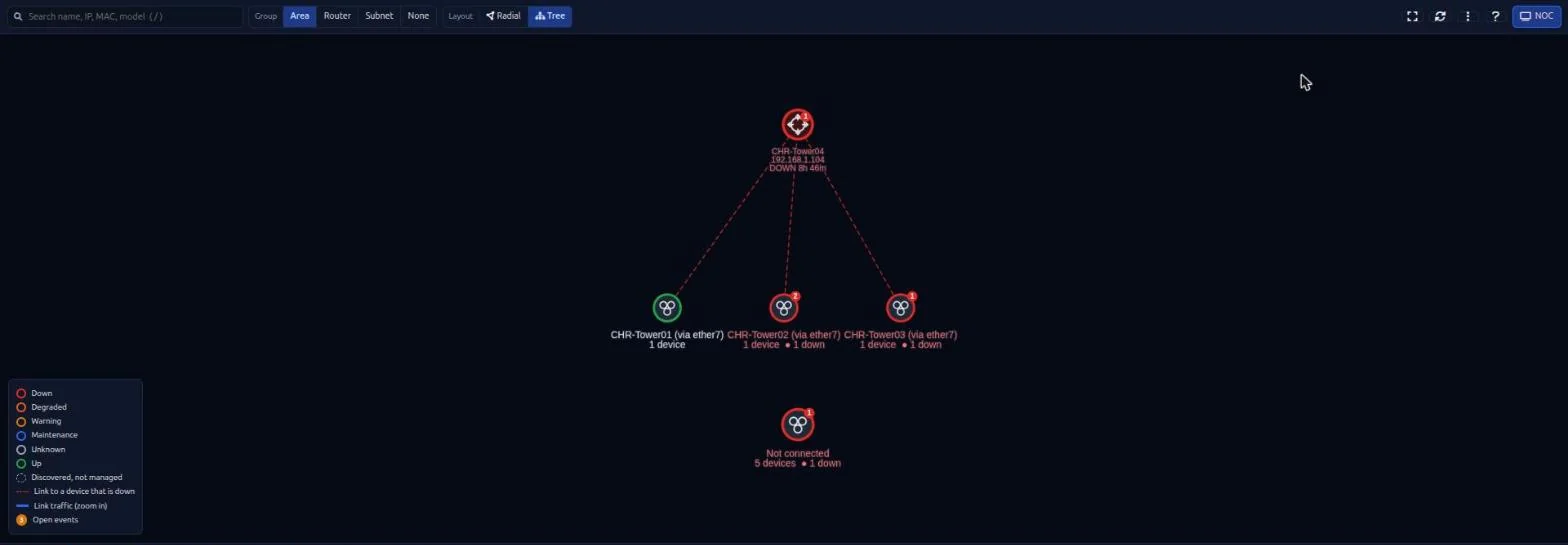
Switch between radial and hierarchical tree layouts and put the map on a wall screen in full-screen NOC mode.
Devices show a live Offline state and their uptime, so the NOC sees what is down right now.
MikroWizard detects reboots and shows the cause taken from the RouterOS logs.
Alerts are suppressed while a device is updating or rebooting, so planned firmware work does not page anyone.
Set how many days of monitoring data to keep, with daily clean-up. The default is 365 days.
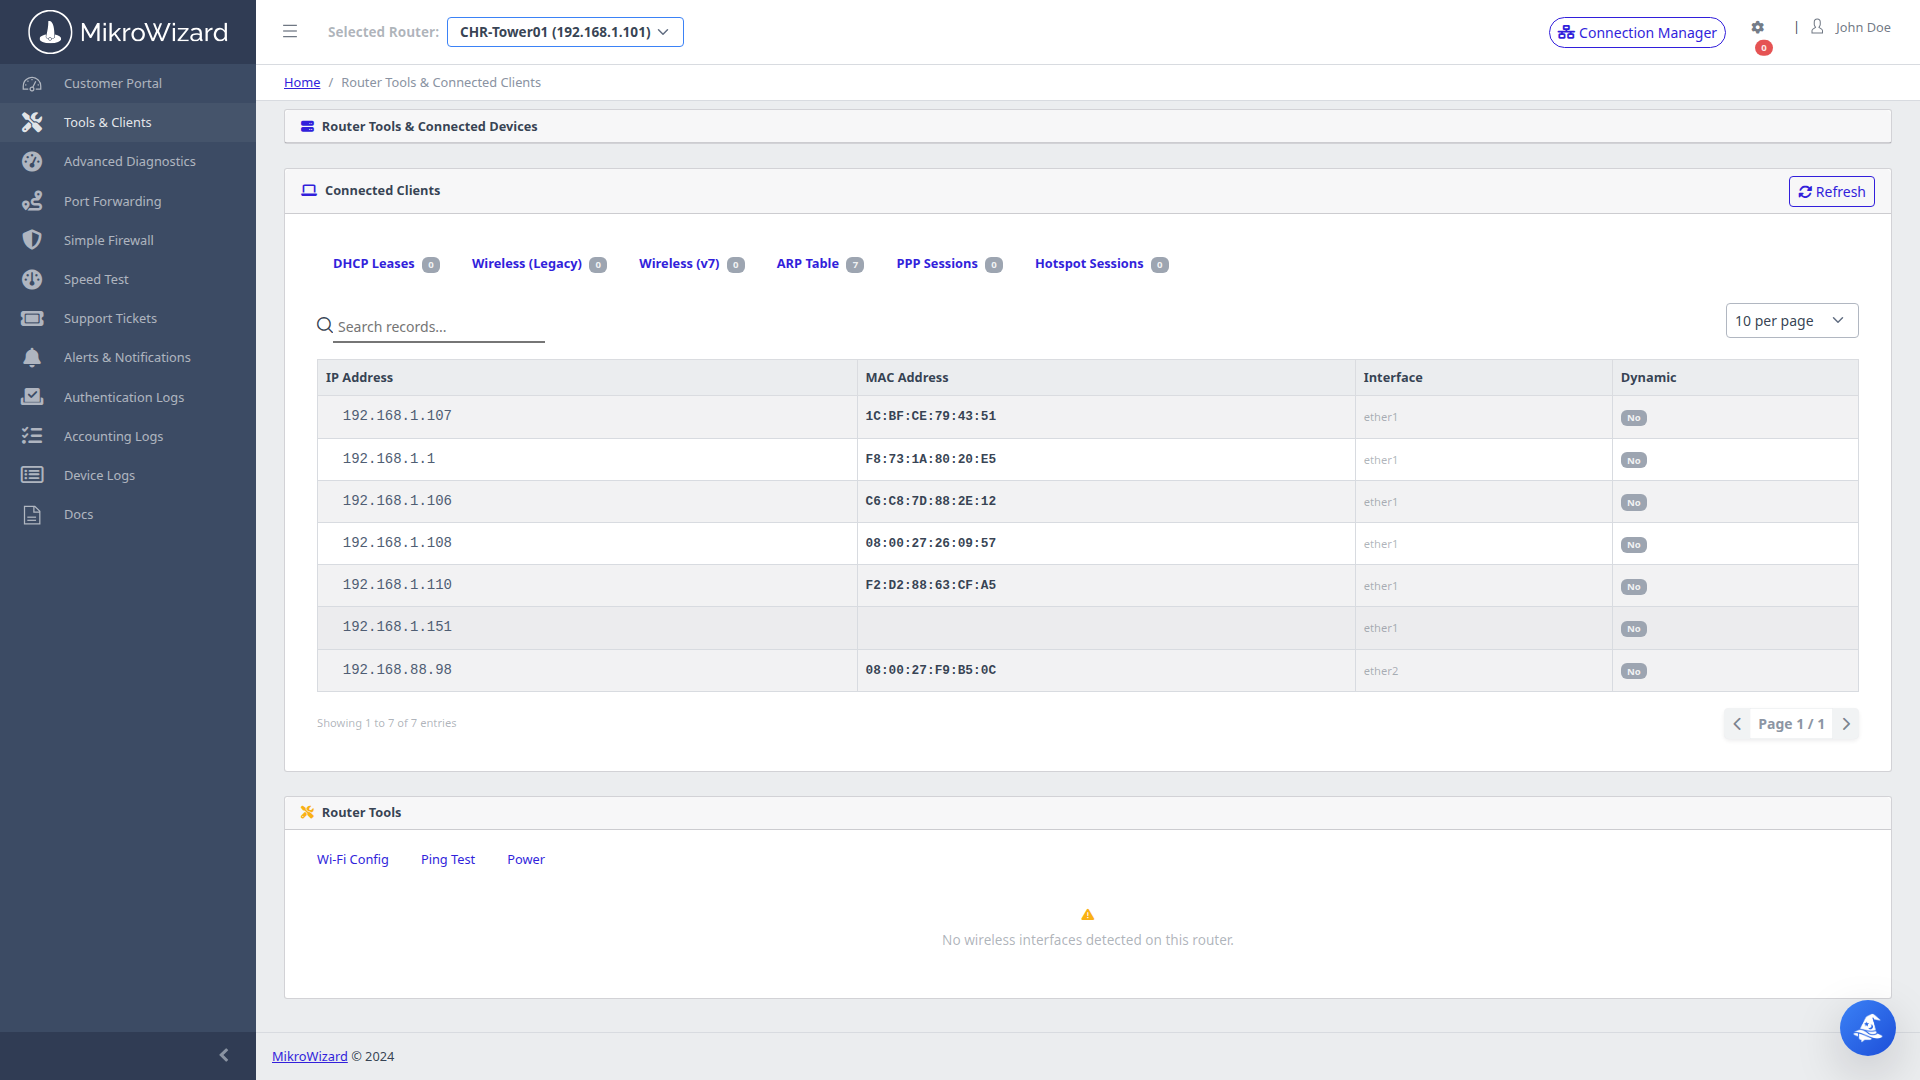
Monitor active DHCP leases, static reservations, and client hostnames across all managed MikroTik DHCP server instances in real time.
Deploy the wallboard in your operations center today. High-density tiles, L2 graph maps, and instant triage.

 MikroWizard